
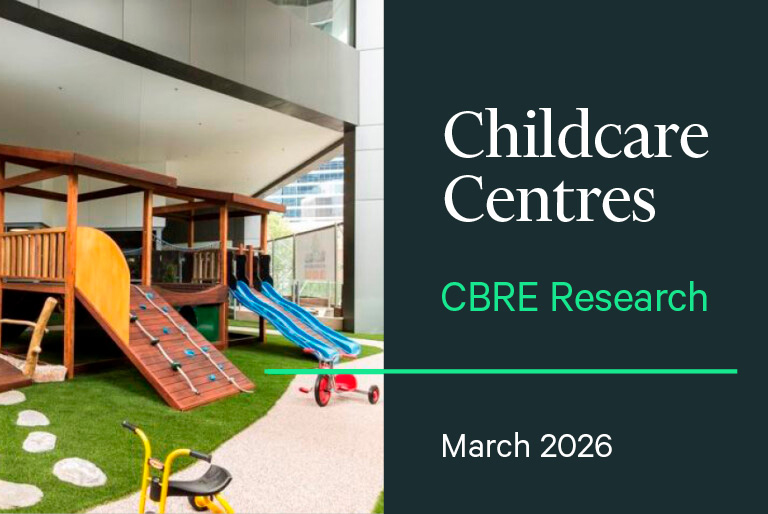
CBRE Research March 2026: Intelligent Investment in Child Care Centres — What the Latest Data Tells Us
CBRE’s March 2026 Early Education report puts a number on something the market has been feeling for two years — Australian childcare is now an A$60 billion sector trading at metro yields that were unthinkable a decade ago. CBRE Research (March 2026) has given ChildcareLink permission to cite this report, and the numbers below are theirs. The translation for buyers, sellers and investors is ours.
This is the article we wish existed when clients ask us, “What is the data actually showing right now?”
The Market in One Page
The headline scale numbers from CBRE Research (March 2026):
- Sector size: approximately A$60 billion, with around 9,750 centres nationally and the centre count growing at roughly 3% per annum.
- Children served: around 840,000 children, averaging 34 hours of attendance per week.
- Net new supply: approximately 30,000 new places added each year, against around 5,000 places lost to closures annually — a net add of ~25,000 places per year.
- Concentration: the top three operators control only 11% of the market — meaning ~89% of the sector is independents, small groups and mid-tier portfolios.
The first time you put these four lines side by side, the asset class snaps into focus. This is an essential-services market, structurally undersupplied, dominated by independent operators, and growing in centre count year after year. That combination is what has driven the institutional money into the sector — and what is now driving the yield prints we look at every week.
ChildcareLink Insight: The 11% top-three share is the number most outside-the-industry buyers underestimate. In retail, fuel, supermarkets or aged care, the top three players usually control 50–80% of the market. In Australian childcare, ~89% of centres are independent or small-group owned. That’s why genuine transaction flow keeps happening — the supply of sale-able assets is enormous. |
For the broader investment framework, see our pillar guide on childcare property as an investment — this article is a market-data update on top of that thesis, not a replacement for it.
What 2025 Yields Are Actually Telling Us
CBRE Research (March 2026) puts the market yield band at 4.00% to 6.00%, with yields having tightened approximately 9 basis points over the past 12 months. The standout 2025 print they highlight is the G8 Education divestment in Vaucluse, NSW at a 3.31% yield — one of the lowest childcare cap rates ever recorded in this country.
Transaction volume tells the same story. CBRE Research (March 2026) reports 2025 transaction volumes of approximately A$850 million — almost double the normal annual run rate of around A$450 million. That is a banner year, not a typical year.
The mistake we see investors make with this data is to read “metro yields are now under 4%” and either (a) assume the run is over and walk away, or (b) assume every metro centre is worth a sub-4% cap rate. Neither is right. The 3.31% Vaucluse print is one of the tightest in market history; the ~9bps tightening across the broader band is the average compression. Most quality metro freehold childcare is still trading in the 4.00–5.25% range per CBRE Research (March 2026), with regional and outer-metro centres trading toward the 5.50–6.00% end of the same band.
For how cap rates actually work in childcare — gross vs net, reversion risk, lease structure impact — see our deeper article on childcare cap rates in Australia. We don’t re-derive that mechanics here; the point of this article is the data update.
ChildcareLink Insight: A 9-basis-point tighten across a 4–6% band sounds small, but on a $300,000 rent it is the difference between a $5.45M and a $5.56M sale price — about $110,000 in landlord equity, created by sector compression alone, in 12 months. |
The Income Side: Net Leases, CPI+, and Rent Per Place
CBRE Research (March 2026) profiles the standard institutional childcare lease as follows:
- Net lease structure (tenant absorbs operating outgoings)
- CPI+ rent escalation in the range of 3–4% per annum
- Weighted Average Lease Expiry (WALE) of 15–20 years, plus options
- Rent typically 8–20% of revenue
- Indicative rent per licensed place: metro ~A$4,500; commuter ~A$4,000; regional A$3,000–A$3,500
That structure is exactly why the asset class trades at the yields it does. A 15–20 year net lease with CPI+ escalation against an essential service tenant is, in commercial-property terms, about as close to a long-dated inflation-linked income stream as you can build outside of government-leased infrastructure. Insurance funds and REITs are paying compressed yields for that income profile, not for the building itself.
For operators reading this, the rent-to-revenue band of 8–20% per CBRE Research (March 2026) is the most important sanity check on a lease. The lower end of that band (8–12%) is what we typically see for centres operating at scale on stabilised occupancy; the higher end (15–20%) is where you start to see margin pressure that affects sale value when an operator goes to exit. For how to benchmark this on your own centre, see our article on what is a fair rent for a childcare centre and the deeper mechanics in the lease explained pillar.
Demand Is Bigger Than Anyone Realised
This is the section of the CBRE report that most surprised us.
CBRE Research (March 2026) reports female workforce participation at 81% for women aged 30–34, up by approximately 34 percentage points over the last 40 years. The new Child Care Subsidy (CCS) 3-Day Guarantee, effective from January 2026, has removed the activity test for a guaranteed three days of subsidised care. Together, these two structural shifts feed straight into the demand pool.
The forward maths CBRE Research (March 2026) sets out:
- Base case: the sector needs around 11,000 new places per annum to keep pace with demand
- Bull case: that requirement rises to approximately 24,000 places per annum if the take-up rate moves to 0.60
We currently net-add ~25,000 places per year (CBRE Research, March 2026 — 30,000 new minus 5,000 closures). On the base case, that’s a slight oversupply. On the bull case, it’s a meaningful undersupply. The actual outcome will sit somewhere between — and that is exactly the window in which 2025’s transaction prints were made.
ChildcareLink Insight: The Three Day Guarantee is a CCS policy change, but the read on a P&L is an occupancy change. Centres that were under-occupied mid-week (Tuesday/Wednesday/Thursday) before January 2026 are exactly the centres CBRE’s demand maths is talking about. For the operator and buyer mechanics of that policy, see our Three Day Guarantee deep dive. |
The Margin Picture
CBRE Research (March 2026) puts operator margins in the 12–22% range, and owner-occupier returns in the 15–40% range when the operator owns the freehold. The width of those bands is the story: the difference between a 12% operator and a 22% operator is almost always staff cost discipline, occupancy management and lease structure, in that order.
When we underwrite a centre on the buy side, we are not pricing the average margin in CBRE’s band — we are pricing the adjusted margin that we believe a competent operator can run the centre at within 24 months. That gap, between statutory and adjusted, is where most going-concern price negotiation actually happens. For the mechanics, see our article on EBITDA adjustments childcare buyers must understand and the broader valuation pillar.
What This Means If You’re Buying, Selling, or Holding
Same data, three different reads.
If you’re buying in 2026: the CBRE Research (March 2026) numbers say the metro yield band has compressed and bidding is competitive — but the demand maths (11,000–24,000 places needed per annum) and the 89% independent share of the market mean genuine acquisition opportunity is still flowing through. Don’t anchor to the 3.31% Vaucluse print as a market benchmark; that was a portfolio asset to a major institutional buyer. For the typical single-site freehold or going-concern, the 4.50–5.50% range is where competitive bids are clearing per the CBRE band. Run an indicative valuation before bidding — our free childcare estimator anchors the conversation to defensible numbers, not seller expectation.
If you’re selling in 2026: the data is on your side, but the band is wide. A centre with a 15+ year net lease, CPI+ escalation in the 3–4% band per CBRE Research (March 2026), rent at 10–14% of revenue, and a competent operator covenant is in the tightest end of the yield range. A centre with a shorter WALE, lower margin, or rent at the higher end of the 8–20% range is closer to the upper end. The 2025 transaction volume of A$850 million per CBRE Research (March 2026) tells you the window is open — but window timing is not the same as preparation. Get the numbers and the lease in order before going to market.
If you’re holding: the ~9bps compression in the past 12 months per CBRE Research (March 2026) has lifted landlord equity without you doing anything. That’s the macro tailwind. The micro question is whether your tenant covenant, rent review structure and remaining WALE will hold that equity through the next cycle. For long-term holders, the structural answer is in the demand maths — sector growth of 3% per annum in centre count against 11,000–24,000 places of underlying demand per annum is a multi-decade thesis, not a 12-month trade. For the broader long-cycle thesis, see our Childcare Market Outlook 2025–2026.
Key Takeaway
The CBRE Research (March 2026) report confirms three things at once: childcare in Australia is now a A$60 billion essential-services asset class, 2025 was a genuinely outsized transaction year at A$850 million, and the demand maths (11,000–24,000 new places needed per annum) supports a multi-cycle thesis. The investor question for 2026 is not whether to be in the sector — it is which asset, on which lease, in which catchment, and at which yield. The data is the easy part. The execution is everything.
Thinking about buying, selling or valuing a childcare centre in 2026? Run an indicative number first at childcarelink.com.au/estimator, then talk to ChildcareLink for a confidential conversation about your specific asset. Visit childcarelink.com.au or contact our team directly.
Sources
- CBRE Research, “Child Care Centres: Intelligent Investment”, March 2026 — sector size, centre count, yield band, transaction volume, lease structure, rent per place, margin ranges, demand maths and policy data. Cited under permission granted to ChildcareLink.
- ChildcareLink transaction and advisory experience, 2024–2026 — framing, audience-segmented analysis, and practical advisory commentary only.
Disclaimer: The information provided in this article is for general informational purposes only and does not constitute financial, legal, or professional advice. ChildcareLink recommends seeking independent professional advice tailored to your specific circumstances before making any business or investment decisions.